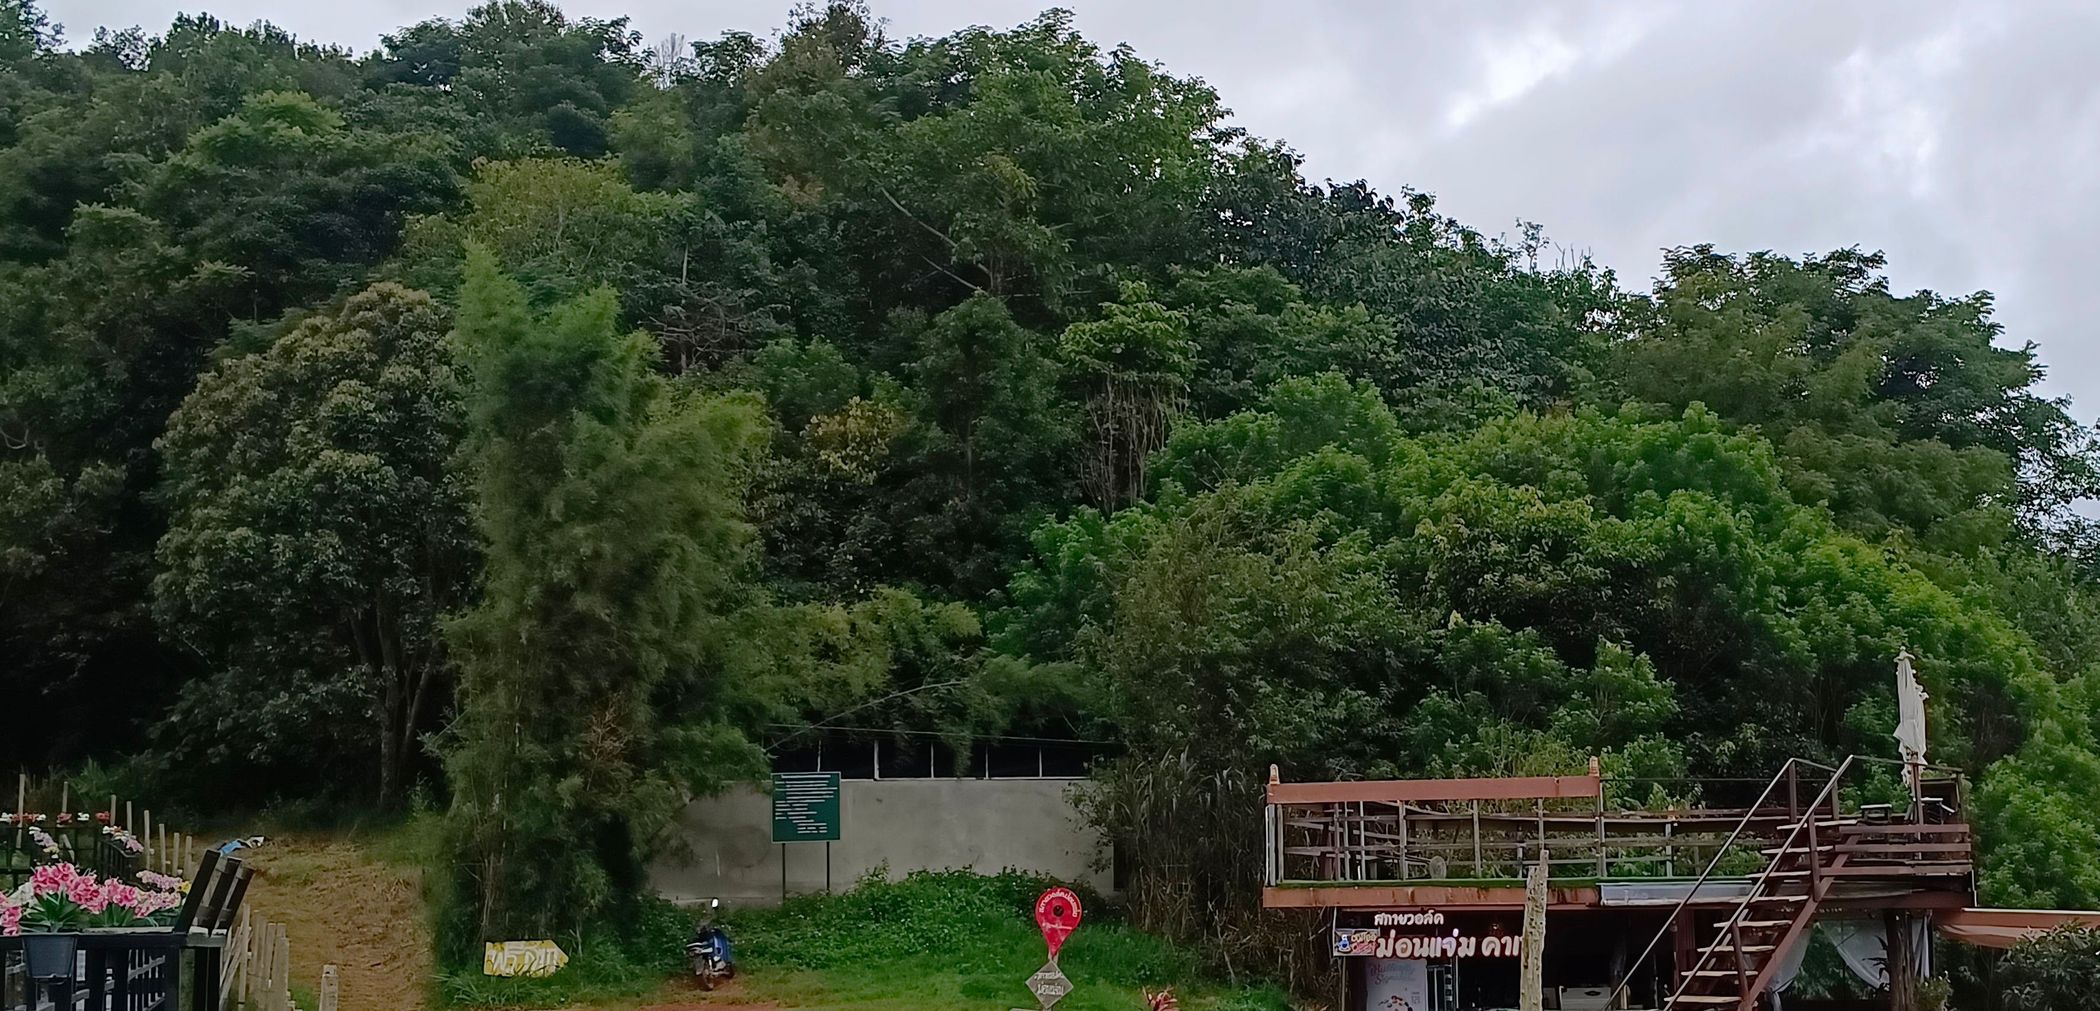
โครงการนี้ได้รับการสนับสนุนจากมูลนิธิสถาบันราชพฤกษ์ โดยดำเนินงานฟื้นฟูระบบนิเวศป่าดิบชื้นด้วยวิธีพรรณไม้โครงสร้างที่ม่อนแจ่ม โครงการนี้เริ่มดำเนินการในปี พ.ศ. 2565 ถึง พ.ศ. 2567 ครอบคลุมพื้นที่ 10 ไร่ และมีการปลูกต้นไม้ 2,000 ต้น จาก 22 ชนิดพันธุ์ไม้ท้องถิ่น เพื่อส่งเสริมการฟื้นตัวตามธรรมชาติที่มีอยู่เดิม พื้นที่ที่ได้รับการฟื้นฟูเป็นป่าดิบชื้นใกล้กับจุดชมวิวและแหล่งท่องเที่ยวของม่อนแจ่ม ซึ่งอยู่ติดกับอุทยานแห่งชาติดอยสุเทพ-ปุย แม้ว่าพื้นที่นี้จะเคยได้รับการฟื้นฟูมาก่อนในปี พ.ศ. 2555 (โดยการสนับสนุนจาก PATT) แต่การฟื้นฟูครั้งนั้นไม่ประสบความสำเร็จเนื่องจากขาดการบำรุงรักษาและข้อจำกัดทางการเงิน หลังจากการปลูกต้นไม้ ได้มีการบำรุงรักษาพื้นที่ (การกำจัดวัชพืชและการใส่ปุ๋ย) เป็นเวลา 2 ฤดูฝนถัดมา มีการติดตามตรวจสอบต้นไม้ที่ปลูก ความหลากหลายทางชีวภาพ และปริมาณคาร์บอนในพื้นที่ที่ได้รับการฟื้นฟู เพื่อประเมินความสำเร็จของการฟื้นฟูและสุขภาพของระบบนิเวศ การสำรวจเหล่านี้ดำเนินการในแปลงควบคุม (ที่ไม่มีการแทรกแซงการฟื้นฟู) (CON), แปลงฟื้นฟูใหม่ที่ปลูกในปี พ.ศ. 2565 (MC22), แปลงฟื้นฟูเก่าที่อยู่ติดกันที่ปลูกในปี พ.ศ. 2555 (MC12) และป่าอ้างอิง ซึ่งเป็นป่าดั้งเดิมที่ถูกรบกวนอยู่บ้างติดกับพื้นที่ปลูก
ประสิทธิภาพของต้นไม้
การติดตามตรวจสอบต้นไม้ที่ปลูกเพื่อเก็บข้อมูลพื้นฐาน (Baseline data :BL) ดำเนินการเมื่อสิ้นสุดฤดูฝนแรก (R1) และสิ้นสุดฤดูฝนที่สอง (R2) โดยวัด เส้นผ่านศูนย์กลางบริเวณโคนต้น (Root Collar Diameter: RCD) ด้วยเวอร์เนียร์คาลิปเปอร์ และวัด ความสูงของต้นไม้ ด้วยเทปวัด รวมถึง ความกว้างทรงพุ่ม ณ จุดที่กว้างที่สุด นอกจากนี้ ยังมีการให้ คะแนนสุขภาพ แก่ต้นไม้แต่ละต้น พร้อมบันทึกรายละเอียดเกี่ยวกับปัญหาด้านสุขภาพที่สังเกตพบ โดยสรุป อัตราการรอดชีวิต โดยรวมของต้นไม้ที่ปลูกอยู่ที่ 96% เมื่อสิ้นสุดฤดูฝนแรก และลดลงเหลือ 84% เมื่อสิ้นสุดฤดูฝนที่สอง ทั้งนี้ มี 13 ชนิดจากทั้งหมด 22 ชนิดที่ทดสอบมีคะแนนสมรรถนะเกิน 50% ของคะแนนสูงสุดที่เป็นไปได้

ความหลากหลายทางชีวภาพ
สำหรับการติดตามความหลากหลายทางชีวภาพนั้น การสำรวจนก ใช้วิธีการสังเกตโดยตรงด้วยกล้องส่องทางไกล ส่วน การสำรวจสัตว์เลี้ยงลูกด้วยนม ใช้วิธีการใช้กล้องดักถ่ายภาพ
ผลการสำรวจพบว่าชุมชนนกและสัตว์เลี้ยงลูกด้วยนมในพื้นที่ศึกษาทั้งหมดมีความ หลากหลายของชนิดพันธุ์สูงมาก โดยรวมแล้ว พบ นกทั้งหมด 125 ชนิด (ไม่รวม 11 ชนิดที่ไม่สามารถระบุได้) ซึ่งเป็นตัวแทนจาก 40 วงศ์ ตลอดทั้งพื้นที่และช่วงเวลาการสังเกตทั้งหมด
สำหรับสัตว์เลี้ยงลูกด้วยนม กล้องดักถ่ายภาพ แสดงให้เห็นว่ามี กิจกรรมของสัตว์เลี้ยงลูกด้วยนมสูงกว่าในแปลงป่า เมื่อเทียบกับแปลงควบคุม แม้ว่าพื้นที่ดังกล่าวจะถูกรบกวนและแยกส่วนอย่างมาก แต่ก็ยังคงรักษาสัตว์เลี้ยงลูกด้วยนมขนาดเล็กถึงขนาดกลางไว้ได้ เช่น เสือดาว, ตัวนิ่ม, หมูหริ่ง, ชะมดเช็ด, ชะมดแผงหางปล้อง และสุนัขจิ้งจอก

คาร์บอน
การติดตามคาร์บอนในพื้นที่ศึกษาที่ม่อนแจ่มนั้น ดำเนินการโดยใช้ การสำรวจด้วยแปลงวงกลมทั้งหมด 8 หน่วย ในแต่ละพื้นที่ทั้งสี่แปลง ได้แก่: แปลงควบคุม, แปลงฟื้นฟู 2 แปลง และป่าอ้างอิง โดยคาร์บอนถูกประเมินจากสามแหล่งได้แก่ 1.ต้นไม้ ประเมินโดยใช้สมการอัลโลเมทรี (allometric equations)
Carbon monitoring at the Mon Cham plot system was performed using 8 circular sampling units in each of four areas: control plot, 2 restored plots and reference forest. Carbon was assessed in three pools: i) trees, by allometric equations, ii) ground vegetation, by weighing dry mass and iii) soil, by analysis of organic matter content. Surveys were performed twice during the project period, just over 14 months apart. Carbon accumulation during restoration was rapid, with levels in the young and old restoration sites attaining 22% and 54% that of reference forest within 2 and 12 years respectively following tree planting. The oldest restored forest (MC12) currently stores 4-5 times more carbon than the control plot.


